Shout out to Aron Roberts. Within 24 hours of sharing this thread to Twitter, Adam Goldstein (FIRE VP of Research) responded. This led to some friendly back and forth in the DMs, followed by a more detailed response from their senior research fellow, Sean Stevens.
To see Adam’s off the cuff response in the replies (including some very good info on the history of warning schools predating the first iteration of the College Free Speech Rankings in 2020), click here. For Sean’s response (posted with permission), see below.
From Sean Stevens:
Hey,
Sorry for taking a little bit to respond, I wanted to give you a thoughtful response to what was a really good dive into the data -- something that I don't see a lot of people do. I am also not sure what you and Adam have corresponded about but I'm happy to be in touch.
Ultimately I think your concerns are more about the validity of the rankings -- do they capture/measure the speech climate on the campuses fairly accurately -- and not the reliability of the measures. Statistically the measures for comfort, tolerance, disruptive conduct, and administrative support are psychometrically sound; they have more than acceptable reliability, cluster together as constructs in exploratory and confirmatory factor analyses, and generate repeatable results (we've asked many of the same questions each year and in other samples). So, I think your concern is about whether they -- or the way they are combined -- could better measure what they're trying to capture. Does that sound right?
If it is, we do share that concern and have made changes to the survey and scoring each of the past three years in an attempt to better capture the speech climate on these campuses. We've tweaked or changed questions and we've expanded what we include in the rankings. This year we added data from our Scholars Under Fire and Campus Disinvitation databases, penalizing schools where scholars were sanctioned or speakers were disinvited, but also providing bonuses to a school for supporting a scholar's expression and not sanctioning them. These additions go a long way to explaining why yellow light schools like Columbia, UPenn, and Yale are at the bottom of the rankings. These schools had multiple scholars sanctioned and also experienced successful disinvitations. We consider both of these things indicative of a poor speech climate and think that those kinds of actions send a message to the students on those campuses about what can and cannot be freely expressed. Our plan is to expand this next year to include incidents where schools either supported or sanctioned student expression.
Now, let me give you a few observations I/we've made in the 3 years of doing this survey and the rankings themselves, as they may be relevant before tackling your questions.
First, the student body at most schools is predominantly to overwhelmingly liberal, the latter being the case at many of the more elite universities and smaller liberal arts colleges. Overall, most schools, even the handful of ones whose student bodies are predominantly conservative, are still more tolerant of liberal speakers than conservative ones. Schools like Purdue, Kansas State, and Mississippi State have a low tolerance difference (the absolute value of tolerance libs - tolerance cons), and are not as tolerant of liberal speakers (but still more tolerant of them than conservative speakers) as some of the smaller elite universities (e.g., Ivy's) and the liberal arts schools. Students at those latter schools tend to be more liberal, very tolerant of liberal speakers and fairly to very intolerant of conservative ones. While there is plenty of variability in "liberal" viewpoints, liberal students on such campuses tend to report a comfortable expression climate where they can have open and honest conversations about a variety of things. But, the more moderate (which includes liberal students closer to the center) and conservative students do not feel the same way.
All of this suggests to us that those campuses are fairly hostile to non-liberal viewpoints, but that the same is not the case for liberal viewpoints at schools like KState, Purdue, etc., even though they aren't as high on tolerance for liberal speakers. Schools like UChicago and Claremont McKenna are interesting in a different way. They both have very liberal student bodies and are highly tolerant of liberal speakers. But, they are also both, when compared to most of the other schools surveyed, pretty tolerant of conservative ones too. They both still have a bias as evidenced by their tolerance difference, but there seems to be less hostility to non-liberal viewpoints on these very liberal campuses compared to schools like Columbia, UPenn, Yale, etc.
Another thing is that liberal students are more likely to find shoutdowns, blocking entry, and using violence to stop a speech acceptable than more moderate and conservative students. This is a national trend in the data, not something that varies much campus to campus -- although at a number of the Ivy's and the smaller liberal arts colleges this difference is particularly pronounced. Here are correlations for each of the tolerance constructs with disruptive conduct for all of the schools surveyed.
Tolerance Liberal Speakers with Disruptive Conduct: -.6689; meaning that as a school's tolerance for liberal speakers goes up, its score on disruptive conduct goes down and students find it more acceptable.
Tolerance Conservative Speakers with Disruptive Conduct: .5295; as tolerance for conservative speakers goes up, score on disruptive conduct goes up and students find it less acceptable.
Tolerance Difference with Disruptive Conduct: -.7428; as tolerance difference goes up, score on disruptive conduct goes down and students find it more acceptable.
Mean Tolerance with Disruptive Conduct: -.1753; not nearly as strong as the first three, but as mean tolerance goes down, score on disruptive conduct goes up and students find it less acceptable.
I think these observations help somewhat explain the weird disconnect between the rank for mean tolerance and the rank for disruptive conduct. Schools like Yale, Columbia and others do well on mean tolerance because of their very liberal student bodies having very high tolerance for liberal speakers, and they don't do badly on their overall ranking for tolerance of conservative speakers. But, because their student bodies are overwhelmingly liberal (and the same is the case for UChicago) these schools have lower disruptive conduct scores, and they rank average to poorly on that construct.
Like you, we have concerns about the speech codes being too influential, for one thing I wonder how aware students are of said policies in general and thus how much they do or do not influence their perception of the campus speech climate. I would argue that they are important to factor in (I presume Adam has made this argument too) and that the way they were factored in this year, compared to previous years, is an improvement. The reason why is that in 2020 and 2021 the schools were basically ordered green light schools, yellow light schools, and then red light schools with a few exceptions. I'd be happy to send you those reports if you'd like them, they're probably still on our website but not that easy to find. Plus as you note, this year there is a yellow light school in the top 5 (OK State), there are some red light schools that do fairly well (e.g., Notre Dame), and some green light schools that do not (e.g., Duke). In other words, they seem less influential on the current rankings when compared to previous ones.
On treating the warning schools differently, I don't know exactly what if anything Adam covered there, but we've long treated them as qualitatively different from other schools and all of those schools (save for Hillsdale, see below) have had a warning rating for years. For instance, in the first ever Spotlight on Speech Codes report from 2006, we explain students wouldn't expect free speech rights at BYU, and in the 2007 report, we explicitly set the Warning schools aside (page B4 of this doc — instead of calling them Warning schools back then, we said they were "not rated," terminology we later ditched because it was confusing). So we didn't just recently identify these schools as problematic for speech (another example is here, from 2009). Because we consider them qualitatively different from the other schools, it is not statistically appropriate for us to compare them to the other 203 schools and standardize their scores in the same way. We made the decision to standardize the scores this year, but we did treat the warning schools in a similar way last year. We presented their scores, but didn't rank them. This was denoted by an asterisk in the rankings, they just weren't set aside in their own table.
Hillsdale is a special case as their warning rating was done internally and it isn't listed on our site. After the first rankings in 2020 an alumnus requested that Hillsdale be surveyed so we had our Policy Reform department rate their policies. I'd be happy to put you in touch with them if you wanted more information on why Hillsdale received that rating.
Best,
Sean
Further Questions
Mostly for the diehards at this point, but I’ll pass this along as well. My questions are in block quotes, Sean’s answers in bold.
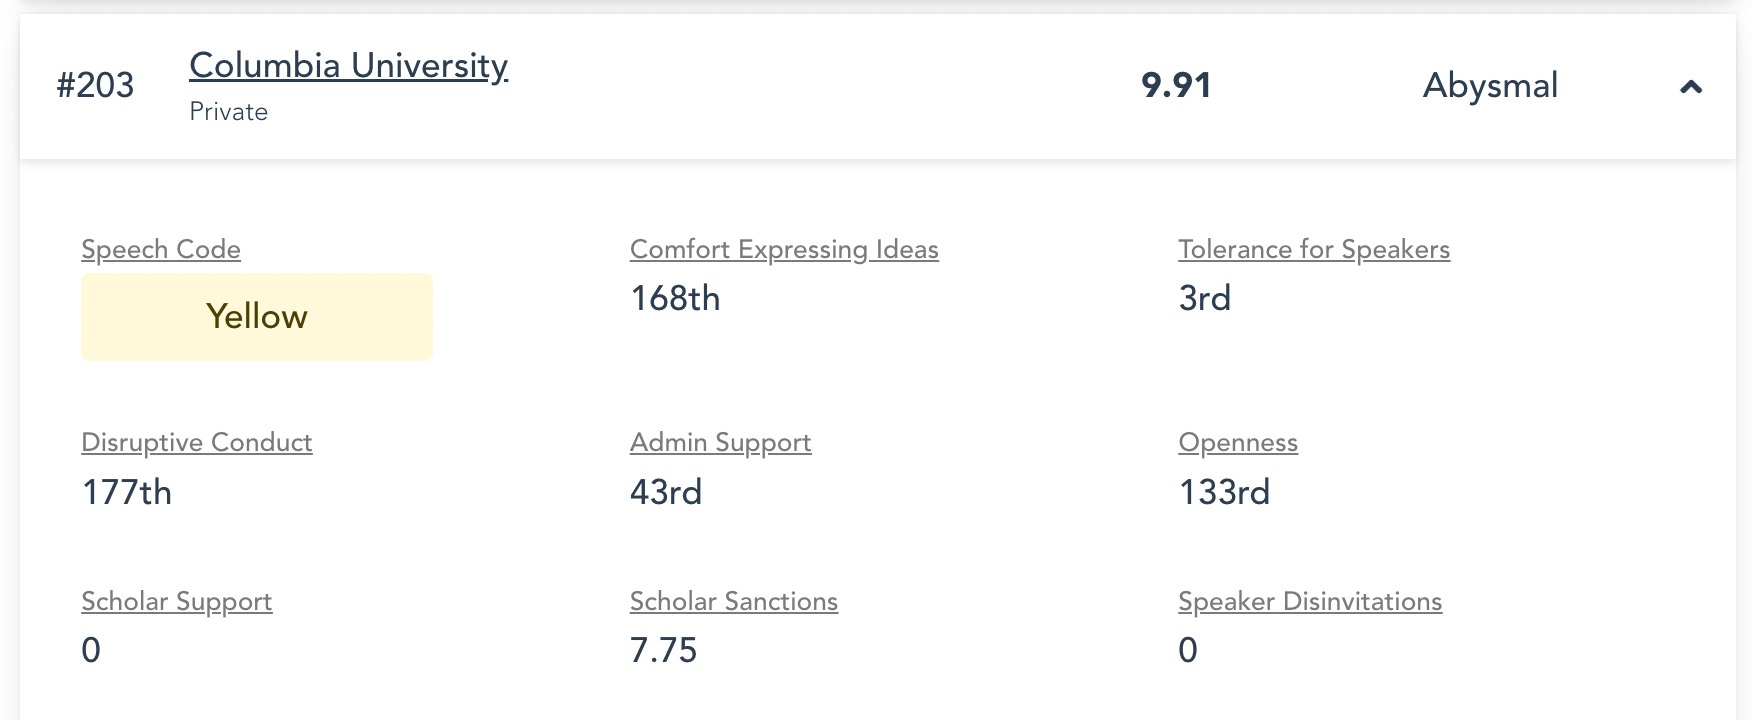
1. Does the Tolerance for Speakers ranking include both the mean tolerance and tolerance difference constructs? That was my assumption based on the overall score methodology, but if it only refers to mean tolerance perhaps that would explain e.g. Columbia's top 3 ranking on the summarized component for speaker tolerance:
This is where we probably made a mistake in deciding what to present in the dashboard as it clearly causes some confusion. That ranking is just for mean tolerance, not the tolerance difference. Columbia does fairly poorly on difference (142nd overall), as do most of the lower ranked schools.
2. The negative correlation between mean tolerance and disruptive conduct still seems a bit troubling to me. I understand you as saying that schools with higher average tolerance are also more likely to have students support harassment of speakers and that this arises from schools with many more liberal students than conservative ones. How exactly does having more liberal students explain this disconnect? Perhaps overall support for disruptive conduct tends to be low in student populations, so even a couple more left-wing extremists showing up in the data can skew the disruption measure without hurting mean tolerance too much? Or maybe the general scenarios in the tolerance survey don't elicit strong enough feelings to ban someone from campus, but the same individuals can think of specific examples where they thought it was justified to disrupt speech? I suspect concrete examples of speaker disruption are more readily recalled on some of the elite campuses.
This may have something to do with how those on the left on campus vs. those on the right go about trying to censor expression deemed offensive, etc. FIRE has long documented disinvitation attempts on campus (data goes back to 1998) and we recently began doing the same with attempts to sanction scholars (data currently goes back to 2015, but we are working on adding earlier attempts that have been documented). Both databases make a relative political judgment about the source of the attempt -- either from the left or right of the speaker (there are a few cases where this is irrelevant and they're denoted as NA). We do this because we don't want to infer a speaker or scholar's politics, even though they are quite clear in some cases, and it is fairly easy to make the relative judgment (e.g., a scholar criticizes BLM, a sanction attempt occurs, it's almost always from the left of the speaker's position). There's a very clear and consistent pattern across both databases. More attempts come from the left of the speaker and most of those originate on campus, spurred on by undergrads, grad students, and/or faculty, issuing demands to the campus administration (e.g., disinvite the speaker, suspend or terminate the scholar). But, when they do originate from the right of the speaker they are more likely to come from off-campus and tend to be initiated by off-campus actors like activist organizations or politicians. The former group tends to use protest -- which at times has crossed over into illiberal forms (e.g., Murray at Middlebury, many Milo events, Heather MacDonald at CMC) -- to restrict expression they do not like, while the latter tends to use legal and legislative methods. So, when we then ask students if they find shouting down a speaker acceptable to some degree, it's not that surprising that the more liberal students say it is. Here's where it gets more speculative on my part, but, as the student body begins to skew more liberal it 1) becomes more and more likely for one to find more "far left" or "very liberal" students on a campus -- the ones who typically find these actions more acceptable. Then, 2) if and/or when a conservative speaker is invited to campus, these campuses will be more likely to oppose said invitation and in some cases see the illiberal actions as necessary.
This also may have to do with (see #4 below for more detail, I did answer that one first) us not mentioning a specific speaker to shoutdown, block entry to, or use violence against. We don't know who students have in mind as the speaker when they are being asked these questions about illiberal protest behavior.
3. The disinvitations/support measures initially seemed irrelevant (in practice) to me, but I can see now that they matter at the bottom of the rankings. Thank you for pointing that out! Do you think they would carry more weight if they were added post standardization instead of before? Would they be getting too much weight in that case?
This was my thinking when we decided to standardize the scores, we included them beforehand because we thought they may get too much weight otherwise.
4. I was also concerned about the divergence between openness and comfort expressing ideas, which seems to show up mainly toward the top of the list. Do you have any comments on that?
I think this may have something to do with the questions and their wording, and with the ideological breakdowns of the student bodies.
Political science research and public polling have long found disconnects between asking about things in the abstract (e.g., Should everyone have the right of freedom of speech?) vs. more specifically (e.g., Should Nazi's be granted freedom of speech?), where the same people will answer the former affirmatively and then object to the latter. The comfort construct includes the five questions asking about comfort expressing ideas across different contexts on campus (e.g., classroom, common campus space) without specifying what the controversial topic is. It also includes the self-censorship items (the frequency question, the reputation question, and the pressure to not express views question). None of these questions mention any specific topics either. The openness question, in contrast, asks the students to identify the topics that are difficult to have an open and honest conversation about on campus and then presents a checklist of specific controversial/hot-button issues (they can select all that apply or none of the above).
So, I think at least two things might be going on here. 1) Students may in general feel comfortable expressing views in various contexts, but still find the conversations about certain specific topics difficult, and 2) students may find the specific topics "more difficult" to discuss on campuses that are more diverse ideologically. This seems to be the case for many of these schools at or near the top of the rankings who have a disconnect on these scores. For instance, Kansas State, Purdue, Mississippi State, and Oklahoma State all have liberal:conservative student ratios of under 2:1, and in some cases these ratios are closer to 1:1 or even skew slightly conservative. This is definitely a hypothesis but: Students may be more likely to encounter counterarguments to their views on these various specific issues on these kinds of campuses so they consider conversations "difficult," but they also may feel more comfortable expressing their views because they are aware that they likely aren't the only one who holds it so expressing it is less risky.
5. How big is the gap between the non-hillsdale warning schools and other private religious schools? Is there a way you quantify that difference?
It's tricky to quantify given that we treat warning vs. non-warning as an apples to oranges comparison. But, that being said, the way I'd go about doing that is to treat them as red light schools, include them in the larger pool, and then see how they would score.
6. What do you make of Eric Kaufmann's recent arguments suggesting that parents would be best served seeking out schools with strong viewpoint diversity, rather than the traditional places we associate with free speech (some of which perform quite well in your rankings)? I hadn't read his newsweek piece before writing my post, but it seems we converge in some of our assessments of these issues (see his response to my thread, which he posted after part 13).
I know Eric fairly well, we actually recently collaborated on a faculty survey on free speech and academic freedom that we're currently analyzing. Personally I agree with his suggestion, I would and would want my children to seek out a place with strong viewpoint diversity.
Overall Impression?
From start to finish, FIRE was remarkably receptive to constructive feedback. Adam chatted with me at length to make sure he understood my concerns and even solicited additional suggestions for how to improve. Sean provided precise answers to my inquiries and acknowledged areas of limitation his team is working to address. I hope I didn’t make life too difficult for either of these guys, because I think they’re really cool.
Most importantly, FIRE made it possible for me to do this kind of critical analysis by making their data and methodology accessible. If they hadn’t, I may never have noticed anything worth questioning in the first place.
Just spotted this post. Thanks so much for engaging with Sean and Adam and sharing Sean's thoughtful comments here, in response to your own questions and observations!
(Plus props to FIRE, as you noted, for sharing their data and methodology.)


Just spotted this post. Thanks so much for engaging with Sean and Adam and sharing Sean's thoughtful comments here, in response to your own questions and observations!
(Plus props to FIRE, as you noted, for sharing their data and methodology.)